


Page 16 - CII-ARTHA
P. 16
ARTHA


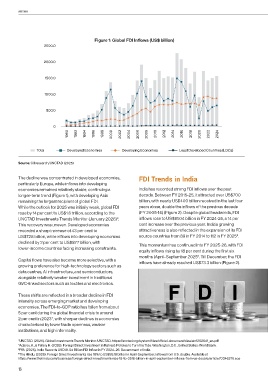
                                           Figure 1: Global FDI Inflows (US$ billion)
                     2500.0


                     2000.0


                     1500.0


                     1000.0


                      500.0


                         0
                               1990  1992  1994  1996  1998  2000  2002  2004  2006  2008  2010  2012  2014  2016  2018  2020  2022  2024


                 Total         Developed Economies     Developing Economies      Least Developed Countries (LDCs)


         Source: CII research; UNCTAD (2025)


         The decline was concentrated in developed economies,   FDI Trends in India
         particularly Europe, while inflows into developing
         economies remained relatively stable, continuing a    India has recorded strong FDI inflows over the past
         longer-term trend (Figure 1), with developing Asia    decade. Between FY 2015-25, it attracted over US$700
         remaining the largest recipient of global FDI.        billion, with nearly US$400 billion received in the last four
         While the outlook for 2025 was initially weak, global FDI   years alone, double the inflows of the previous decade
         rose by 14 per cent to US$1.6 trillion, according to the   (FY 2005-14) (Figure 2). Despite global headwinds, FDI
         UNCTAD Investments Trends Monitor (January 2026) .    inflows rose to US$81.04 billion in FY 2024-25, a 14 per
                                                     3
         This recovery was uneven. Developed economies         cent increase over the previous year. India’s growing
         recorded a sharp increase of 43 per cent to           attractiveness is also reflected in the expansion of its FDI
                                                                                                          5
         US$728 billion, while inflows into developing economies   source countries from 89 in FY 2014 to 112 in FY 2025 .
         declined by 2 per cent to US$877 billion, with        This momentum has continued into FY 2025-26, with FDI
         lower-income countries facing increasing constraints.
                                                               equity inflows rising by 18 per cent during the first six
                                                               months (April–September 2025 . Till December, the FDI
                                                                                         6
         Capital flows have also become more selective, with a   inflows have already reached US$73.3 billion (Figure 2).
         growing preference for high-technology sectors such as
         data centres, AI infrastructure, and semiconductors,
         alongside relatively weaker investment in traditional
         GVC-linked sectors such as textiles and electronics.

         These shifts are reflected in a broader decline in FDI
         intensity across emerging market and developing
         economies. The FDI-to-GDP ratio has fallen from about
         5 per cent during the global financial crisis to around
                        4
         2 per cent in 2023 , with sharper declines in economies
         characterised by lower trade openness, weaker
         institutions, and high informality.

         3 UNCTAD. (2026). Global Investments Trends Monitor. UNCTAD. https://unctad.org/system/files/official-document/diaeiainf2026d1_en.pdf
         4 Adarov, A., & Pallan, H. (2025). Foreign Direct Investment in Retreat: Policies to Turn the Tide. Washington, D.C., United States: World Bank.
         5 PIB. (2025). India Records USD 81.04 Billion FDI Inflow in FY 2024–25. Government of India.
         6 The Hindu. (2025). Foreign Direct Investments rise 18% to US$35.18 billion in April-September; inflows from U.S. double. Available at
         https://www.thehindu.com/business/foreign-direct-investments-rise-18-to-3518-billion-in-april-september-inflows-from-us-double/article70346276.ece

         16

