


Page 56 - CII-ARTHA
P. 56
ARTHA


         However, the aggregate picture masks significant       The Debt Structure of States and
         inter-state variation. An analysis of budget estimates for 18   Borrowing Patterns
         major states in 2025–26, which accounts for almost 98.8
         per cent of the total GDP of India, shows that several
         states are breaching or nearing the upper bound of the   Fiscal deficits are financed through different sources,
         FRBM threshold. The highest fiscal deficits (as a share of   including market borrowings, loans from the Centre,
         GSDP) among these 18 states are observed in Madhya    small savings, and other public account liabilities. Fiscal
         Pradesh (4.7 per cent), Andhra Pradesh (4.4 per cent),   deficits are financed through borrowing, leading to
         Rajasthan (4.3 per cent), Punjab (3.8 per cent), and West   accumulation of outstanding liabilities. Rising fiscal
         Bengal (3.6 per cent), indicating persistent fiscal stress in   deficit levels have increasingly translated into higher
         these states. All these states have been showing high   market borrowing by states, which has emerged as the
         fiscal deficit trend over the years (from 2023-24), except   dominant source of financing.
         Punjab and West Bengal. In contrast, several larger states
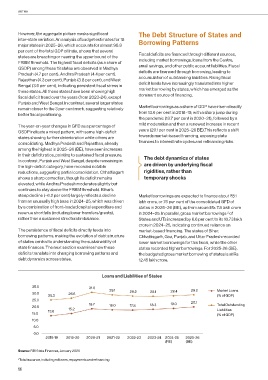
         remain closer to the 3 per cent mark, suggesting relatively   Market borrowings as a share of GDP have risen steadily
         better fiscal positioning.                             from 13.6 per cent in 2018–19, with a sharp jump during
                                                               the pandemic (18.7 per cent in 2020–21), followed by a
                                                               mild moderation and then a renewed increase in recent
         The year-on-year changes in GFD as a percentage of
         GSDP indicate a mixed pattern, with some high-deficit   years (20.1 per cent in 2025–26 BE).This reflects a shift
         states showing further deterioration while others are   towards market-based financing, exposing state
         consolidating. Madhya Pradesh and Rajasthan, already   finances to interest rate cycles and refinancing risks.
         among the highest in 2025–26 (BE), have seen increases
         in their deficit ratios, pointing to sustained fiscal pressure.
         In contrast, Punjab and West Bengal, despite remaining in   The debt dynamics of states
         the high-deficit category, have recorded notable         are driven by underlying fiscal
         reductions, suggesting partial consolidation. Chhattisgarh   rigidities, rather than
         shows a sharp correction, though its deficit remains     temporary shocks
         elevated, while Andhra Pradesh moderates slightly but
         continues to stay above the FRBM threshold. Bihar’s
         steep decline (–6.2 per cent) largely reflects a decline   Market borrowings are expected to finance about 8.1
         from an unusually high base in 2024–25, which was driven   lakh crore, or 76 per cent of the consolidated GFD of
         by a combination of front-loaded capital expenditure and   states in 2025–26 (BE), up from around Rs 7.8 lakh crore
         revenue shortfalls (including lower transfers/grants),   in 2024–25. In parallel, gross market borrowings   of
                                                                                                      2
         rather than a sustained structural imbalance.         States and UTs increased by 6.6 per cent to Rs 10.73 lakh
                                                               crore in 2024–25, indicating continued reliance on
         The persistence of fiscal deficits directly feeds into   market-based financing. The states of Bihar,
         borrowing patterns, making the evolution of debt structure   Chhattisgarh, Goa, Punjab, and Uttar Pradesh recorded
         of states central to understanding the sustainability of   lower market borrowings for this fiscal, while the other
         state finances. The next section examines how these    states recorded higher borrowings. For 2025-26 (BE),
         deficits translate into changing borrowing patterns and   the budgeted gross market borrowing of states is at Rs
         debt dynamics across states.                          12.45 lakh crore.


                                              Loans and Liabilities of States

               35.0                      31.0
                                                  29.1     28.2              28.4     29.2       Market Loans
               30.0            26.6                                 28.1
                      25.3                                                                       (% of GDP)
               25.0
                                         18.7                       18.3     19.0     20.1       Total Outstanding
               20.0            15.2               18.0     17.8
                      13.6                                                                       Liabilities
               15.0                                                                              (% of GDP)
               10.0
                5.0
                0.0
                     2018-19  2019-20  2020-21   2021-22  2022-23  2023-24  2024-25  2025-26
                                                                          (RE)     (BE)

         Source: RBI State Finances, January 2026
         2 Total issuance, including rollovers, repayments and refinancing

         56

