


Page 57 - CII-ARTHA
P. 57
MARCH 2026


           However, in the post-COVID era, central loans have also   Changing Composition of State
           gained prominence, driven largely by sustained GST
           compensation loans (where the Centre borrowed on      Finances: Patterns of Revenue
           behalf of the states, but the liabilities were recorded in   and Spending
           state accounts). Further, part of the recent increase in
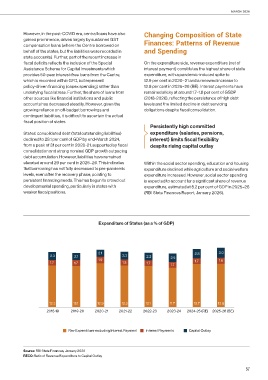
           fiscal deficits reflects the inclusion of the Special    On the expenditure side, revenue expenditure (net of
           Assistance Scheme for Capital Investments which       interest payment) constitutes the highest share of state
           provides 50-year interest-free loans from the Centre,   expenditure, with a pandemic-induced spike to
           which is recorded within GFD, but represent           12.9 per cent in 2020–21 and a renewed increase to
           policy-driven financing (capex spending) rather than   12.8 per cent in 2025–26 (BE). Interest payments have
           underlying fiscal stress. Further, the share of loans from   remained sticky at around 1.7–1.8 per cent of GSDP
           other sources like financial institutions and public   (2018-2026), reflecting the persistence of high debt
           accounts has decreased steadily. However, given the   levels and the limited decline in debt servicing
           growing reliance on off-budget borrowings and          obligations despite fiscal consolidation.
           contingent liabilities, it is difficult to ascertain the actual
           fiscal position of states.
                                                                    Persistently high committed
           States’ consolidated debt (total outstanding liabilities)   expenditure (salaries, pensions,
           declined to 28.1 per cent of GDP by end-March 2024,      interest) limits fiscal flexibility
           from a peak of 31 per cent in 2020-21, supported by fiscal   despite rising capital outlay
           consolidation and strong nominal GDP growth outpacing
           debt accumulation. However, liabilities have remained
           elevated around 29 per cent in 2025–26. This indicates   Within the social sector spending, education and housing
           that borrowing has not fully decreased to pre-pandemic   expenditure declined while agriculture and social welfare
           levels, even after the recovery phase, pointing to    expenditure increased. However, social sector spending
           persistent financing needs. This has begun to crowd out   is expected to account for a significant share of revenue
           developmental spending, particularly in states with   expenditure, estimated at 8.2 per cent of GDP in 2025–26
           weaker fiscal positions.                               (RBI State Finances Report, January 2026).


                                             Expenditure of States (as a % of GDP)


                                             2.1                                       2.8        3.0
                       2.3        2.1                  2.3        2.2        2.5
                                             1.9                                                  1.8
                       1.7        1.7                  1.8        1.7                  1.7
                                                                             1.7


                       12.3       12.1      12.9       12.3       12.1      11.7       12.7       12.8

                      2018-19   2019-20    2020-21    2021-22    2022-23   2023-24  2024-25 (RE)  2025-26 (BE)


                               Rev Expenditure excluding Interest Payment  Interest Payments  Capital Outlay


           Source: RBI State Finances, January 2026
           RECO: Ratio of Revenue Expenditure to Capital Outlay

                                                                                                              57

