


Page 62 - CII-ARTHA
P. 62
ARTHA


         What Determines the Export Preparedness of States


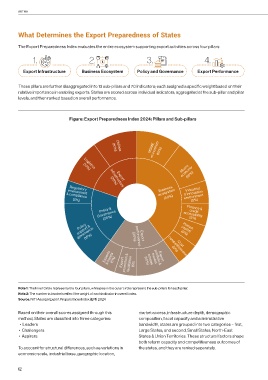
         The Export Preparedness Index evaluates the entire ecosystem supporting export activities across four pillars:

                1.                       2.                       3.                        4.


           Export Infrastructure     Business Ecosystem       Policy and Governance      Export Performance


         These pillars are further disaggregated into 13 sub-pillars and 70 indicators; each assigned a specific weight based on their
         relative importance in enabling exports. States are scored across individual indicators, aggregated at the sub-pillar and pillar
         levels, and then ranked based on overall performance.


                                Figure: Export Preparedness Index 2024: Pillars and Sub-pillars


                                                                    MSME ecosystem   (10%)

                                                   (10%)
                                                     Utilities
                                                                                  Macro (10%)
                                                                                  economy
                                      Logistics
                                      (10%)
                                                     Export
                                                                        Business    Industrial
                                                  infrastructure
                                Regulatory        (20%)
                               environment                              ecosystem  & innovation
                              & compliance                                 (40%)   environment
                                 (5%)                                                 (5%)
                                             Policy &
                                                                                    Finance &
                                            Governance                             accessibility
                                                                                     credit
                                               (20%)
                                                                                     (5%)
                                    Policy
                                    support &               (20%)  performance  Export  Cost
                                    governance
                                                                                  Human
                                                                                 capital
                                                                                 (5%)
                                       (15%)
                                                                             (5%)
                                               Exports & trends  (5%)  Export  promotion &  facilitation   (5%  (10%)  market  Export  competitiveness
                                                                      portfolio &
                                                                   access


         Note 1: The Inner Circle represents the four pillars, while pies in the outer circle represent the sub-pillars for each pillar.
         Note 2: The number in brackets reflect the weight of each indicator in overall index.
         Source: NITI Aayog’s Export Preparedness Index (EPI) 2024


         Based on their overall scores assigned through this   market access, infrastructure depth, demographic
         method, States are classified into three categories:   composition, fiscal capacity and administrative
           •  Leaders                                          bandwidth, states are grouped into two categories – first,
          •  Challengers                                       Large States, and second, Small States, North-East
          •  Aspirers                                          States & Union Territories. These structural factors shape
                                                               both reform capacity and competitiveness outcomes of
         To account for structural differences, such as variations in   the states, and they are ranked separately.
         economic scale, industrial base, geographic location,


         62

