


Page 74 - CII-ARTHA
P. 74
ARTHA


                                    Growth in Merchandise Exports Value 2025 (y-o-y%)


                                                   21.5


                            10.9
                        8.3                    9.6           7.1           7.8
                    6.0               6.7                             5.0               5.6  6.1  6.5
                                  3.3     4.0           4.6                        3.8                3.8
               1.7                                                             1.4


                                                                -8.4
                Q1  Q2   Q3  Q4   Q1  Q2   Q3  Q4   Q1  Q2  Q3   Q4  Q1   Q2  Q3   Q4  Q1  Q2   Q3  Q4
                    United States   European Union    United Kingdom       Japan             China


                              Change in Nominal Effective Exchange Rate (NEER) 2025 (y-o-y%)

                                               6.2      6.3
                                                                                        5.3
                                          4.8
                                      3.8
                    2.8
               2.2                                                    2.0
                        0.4      0.0

                                                   -0.2     -0.6                   -0.8     -0.3
                            -1.4
                                                                          -2.0  -1.8            -1.8
                                                                -3.4                                 -3.6

                    Q2   Q3  Q4   Q1  Q2   Q3  Q4   Q1  Q2   Q3  Q4  Q1   Q2  Q3   Q4  Q1   Q2  Q3   Q4
                United States (Dollar)  European Union  United Kingdom  Japan (Yen)       China (Yuan)
                                       (Euro)           (Pound)


         Note: NEER data is Nominal effective exchange rate (NEER), Index (2010=100) Weighted index, Positive change in NEER
         is appreciation, and negative change in NEER is depreciation
         Source: WTO Stats Database, Total Merchandise Exports Value
         IMF Effective Exchange Rate Data


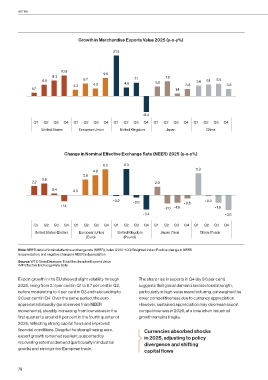
         Export growth in the EU showed slight volatility through   The sharp rise in exports in Q4 (by 9.6 per cent)
         2025, rising from 3.3 per cent in Q1 to 6.7 per cent in Q2,   suggests that global demand and sectoral strength,
         before moderating to 4 per cent in Q3 and rebounding to   particularly in high-value manufacturing, outweighed the
         9.6 per cent in Q4. Over the same period, the euro    lower competitiveness due to currency appreciation.
         appreciated steadily (as observed from NEER           However, sustained appreciation may decrease export
         movements), steadily increasing from low values in the   competitiveness in 2026, at a time when industrial
         first quarter to around 6 per cent in the fourth quarter of   growth remains fragile.
         2025, reflecting strong capital flows and improved
         financial conditions. Despite the strengthening euro,    Currencies absorbed shocks
         export growth remained resilient, supported by          in 2025, adjusting to policy
         recovering external demand (particularly in industrial   divergence and shifting
         goods) and strong intra-European trade.                 capital flows


         74

