
Page 31 - CII ARTHA
P. 31
OCTOBER 2025
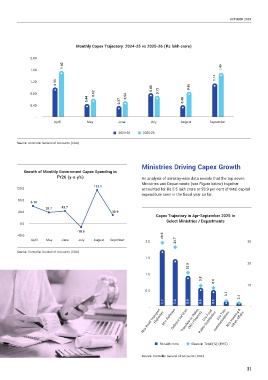
Monthly Capex Trajectory: 2024-25 vs 2025-26 (Rs lakh crore)
2.00
1.60
1.60 1.49
1.14
1.20 0.99
0.80 0.85
0.80 0.62 0.54 0.72
0.44 0.37 0.40
0.40
-
April May June July August September
2024-25 2025-26
Source: Controller General of Accounts (CGA)
Ministries Driving Capex Growth
Growth of Monthly Government Capex Spending in
FY26 (y-o-y%) An analysis of ministry-wise data reveals that the top seven
Ministries and Departments (see Figure below) together
113.1
120.0 accounted for Rs 5.5 lakh crore or 93.9 per cent of total capital
expenditure seen in the fiscal year so far.
80.0
6.10
38.7 43.7
40.0 30.9
Capex Trajectory in Apr-September 2025 in
Select Ministries / Departments
0.0
-10.5
-40.0 29.5
April May June July August Septmber 2.0 24.7 30
Source: Controller General of Accounts (CGA)
1.5
20
15.9
1.0
9.8 8.6
10
0.5
3.1
2.4
1.7 1.4 0.9 0.6 0.5
- -
M/o Road Transport M/o Railways Defence Services (M/o Finance) Public Distribution communications M/o Housing &
D/o Tele-
D/o Food
Transfers to States
Urban Affairs
Highways
Rs lakh crore Share in Total (%) (RHS)
Source: Controller General of Accounts (CGA)
31