
Page 26 - CII ARTHA
P. 26
ARTHA
This sharp easing in input cost pressures marks a significant accrues from sources like sale of investment in assets,
improvement in the overall cost structure. The improvement interest income, write-offs, forex gain, among others. The
has been primarily led by material input costs, the largest higher growth in this income component has likely been a
expense component accounting for nearly 59.0 per cent of major contributor to the sharp improvement in profit margins
total expenses, which grew by a mere 0.4 per cent observed during this period.
year-on-year in Q1FY26. Employee expenses, which
constitute around 9.0 per cent of total costs, continued to
record a stable growth of about 6.0 per cent, reflecting wage
stability that supports demand conditions. Additionally, Sectoral Trends
power and fuel costs declined in absolute terms in tandem
with subdued global crude oil prices, providing further relief The performance of corporates, both in terms of net sales and
and resulting in a discernible moderation in overall expense profit margins, varies widely across sectors. An analysis of 482
growth during the quarter. companies in the BSE 500 category shows that in Q1FY26,
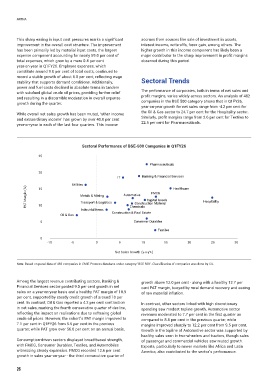
year-on-year growth for net sales range from -4.2 per cent for
the Oil & Gas sector to 24.7 per cent for the Hospitality sector.
While overall net sales growth has been muted, ‘other income
and extraordinary income’ has grown by over 40.0 per cent Similarly, profit margins range from 2.6 per cent for Textiles to
year-on-year in each of the last four quarters. This income 22.5 per cent for Pharmaceuticals.
Sectoral Performance of BSE-500 Companies in Q1FY26
25
Pharmaceuticals
20
IT Banking & Financial Services
Utilities Healthcare
PAT Margin (%) Metals & Mining Automotive Capital Goods Hospitality
15
FMCG
Transport & Logistics
Construction Material
10
Industrial Items Chemicals
Oil & Gas Construction & Real Estate
5 Consumer Durables
Textiles
0
-10 -5 0 5 10 15 20 25 30
Net Sales Growth (y-o-y%)
Note: Based on panel data of 482 companies in CMIE Prowess database under category ‘BSE 500’. Classification of companies was done by CII.
Among the largest revenue contributing sectors, Banking & growth above 12.0 per cent - along with a healthy 12.7 per
Financial Services sector posted 9.0 per cent growth in net cent PAT margin, buoyed by rural demand recovery and easing
sales on a year-on-year basis and a healthy PAT margin of 18.9 of raw material inflation.
per cent, supported by steady credit growth of around 10 per
cent. In contrast, Oil & Gas reported a 4.2 per cent contraction In contrast, other sectors linked with high discretionary
in net sales, marking the fourth consecutive quarter of decline, spending saw modest topline growth. Automotive sector
reflecting the impact on realisations due to softening global revenues moderated to 7.7 per cent in the first quarter as
crude oil prices. However, the cohort’s PAT margin improved to compared to 8.8 per cent in the previous quarter, while
7.1 per cent in Q1FY26 from 5.5 per cent in the previous margins improved sharply to 12.2 per cent from 9.5 per cent.
quarter, while PAT grew over 56.0 per cent on an annual basis. Growth in the topline of Automotive sector was supported by
healthy sales seen in two-wheelers and tractors, though sales
Consumption-driven sectors displayed broad-based strength, of passenger and commercial vehicles saw muted growth.
with FMCG, Consumer Durables, Textiles, and Automobiles Exports, particularly to newer markets like Africa and Latin
witnessing steady expansion. FMCG recorded 12.6 per cent America, also contributed to the sector’s performance.
growth in sales year-on-year - the third consecutive quarter of
26