Page 25 - CII ARTHA
P. 25

OCTOBER 2025


        11.4 per cent in Q3FY25. A substantial increase in 'other   Over the last five quarters, the annual growth rate of total
        income and extraordinary income', which includes items   expenses has been on a moderating trend, falling sharply to
        such as interest income, rental income, and gains on asset   2.7 per cent in Q1FY26 from 5.6 per cent in the previous
        sales, has also contributed to a sharp rise in the bottom   quarter. On a sequential basis, total expenses in Q1FY26
        line of firms.                                          contracted by 6.1 per cent over the last quarter.


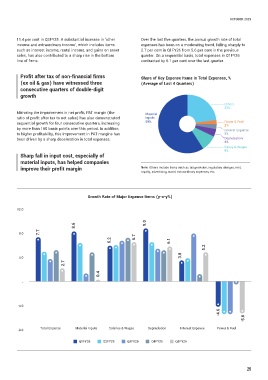
          Profit after tax of non-financial firms               Share of Key Expense Items in Total Expenses, %
          (ex oil & gas) have witnessed three                   (Average of Last 4 Quarters)
          consecutive quarters of double-digit
          growth
                                                                                                     Others
                                                                                                     23%
        Mirroring the improvement in net profit, PAT margin (the   Material
        ratio of profit after tax to net sales) has also demonstrated   Inputs
        sequential growth for four consecutive quarters, increasing   59%                            Power & Fuel
                                                                                                     2%
        by more than 160 basis points over this period. In addition                                  Interest Expense
        to higher profitability, this improvement in PAT margins has                                 3%
        been driven by a sharp deceleration in total expenses.                                       Depreciation
                                                                                                     4%
                                                                                                     Salary & Wages
                                                                                                     9%
          Sharp fall in input cost, especially of
          material inputs, has helped companies
          improve their profit margin                           Note: Others include items such as tax provision, regulatory charges, rent,
                                                                royalty, advertising, travel, extraordinary expenses, etc.


                                        Growth Rate of Major Expense Items (y-o-y%)

         12.0


                                  8.6                             9.0
         8.0      7.7
                                                  6.2        6.7            6.1
                                                                                            5.2

         4.0                                                                      3.8
                              2.7

                                             0.4
           _


         -4.0
                                                                                                  -4.6
                                                                                                             -5.6


         -8.0      Total Expense   Material Inputs  Salaries & Wages  Depreciation  Interest Expense  Power & Fuel

                                    Q1FY25     Q2FY25     Q3FY25    Q4FY25     Q1FY26


                                                                                                               25
   20   21   22   23   24   25   26   27   28   29   30