
Page 21 - CII ARTHA
P. 21
OCTOBER 2025
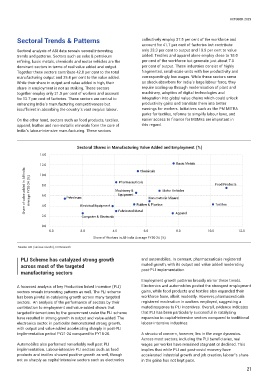
Sectoral Trends & Patterns collectively employ 37.5 per cent of the workforce and
account for 41.7 per cent of factories but contribute
Sectoral analysis of ASI data reveals several interesting only 23.3 per cent to output and 19.9 per cent to value
trends and patterns. Sectors such as coke & petroleum added. Textiles and apparel alone employ close to 18.0
refining, basic metals, chemicals and motor vehicles are the per cent of the workforce but generate just about 7.0
dominant sectors in terms of real value added and output. per cent of output. These industries consist of highly
Together these sectors contribute 42.8 per cent to the total fragmented, small-scale units with low productivity and
manufacturing output and 35.4 per cent to the value added. correspondingly low wages. While these sectors serve
While their share in output and value added is high, their as shock-absorbers for India’s large labour force, they
share in employment is not as striking. These sectors require scaling up through modernisation of plant and
together employ only 21.0 per cent of workers and account machinery, adoption of digital technologies and
for 13.7 per cent of factories. These sectors are central to integration into global value chains which could unlock
enhancing India’s manufacturing competitiveness but productivity gains and translate them into better
insufficient in absorbing the country’s vast surplus labour. earnings for workers. Initiatives such as the PM MITRA
parks for textiles, reforms to simplify labour laws, and
On the other hand, sectors such as food products, textiles, easier access to finance for MSMEs are important in
apparel, leather and non-metallic minerals form the core of this regard.
India’s labour-intensive manufacturing. These sectors
Sectoral Shares in Manufacturing Value Added and Employment (%)
14.0
12.0 Chemicals Basic Metals
Share of value added in All-India Average FY20-24 (%) 8.0 Petroleum Machinery & Non-mettalic Mineral Food Products
10.0
Pharmaceuticals
Motor Vehicles
Equipment
6.0
Rubber & Plastics
4.0
2.0 Electrical Equipment Fabricated Metal Apparel Textiles
Computer & Electronic
0.0
0.0 2.0 4.0 6.0 8.0 10.0 12.0
Share of Workers in All-India Average FY20-24 (%)
Source: ASI (various rounds), CII Research
PLI Scheme has catalyzed strong growth and automobiles. In contrast, pharmaceuticals registered
across most of the targeted muted growth, with its output and value added moderating
manufacturing sectors post-PLI implementation.
Employment growth patterns broadly mirror these trends.
A focussed analysis of key Production linked Incentive (PLI) Electronics and automobiles posted the strongest employment
sectors reveals interesting patterns as well. The PLI scheme gains, while food products and textiles also expanded their
has been pivotal in catalysing growth across many targeted workforce base, albeit modestly. However, pharmaceuticals
sectors. An analysis of the performance of sectors by their registered moderation in workers employed, suggesting a
contribution to employment and value-added shows that muted response to PLI incentives. Overall, evidence indicates
targeted interventions by the government under the PLI scheme that PLI has been particularly successful in catalysing
have resulted in strong growth in output and value-added. The expansion in capital-intensive sectors compared to traditional
electronics sector, in particular demonstrated strong growth, labour-intensive industries.
with output and value-added accelerating sharply in post-PLI
implementation period FY21-24 compared to FY18-20. A structural concern, however, lies in the wage dynamics.
Across most sectors, including the PLI beneficiaries, real
Automobiles also performed remarkably well post PLI wages per worker have remained stagnant or declined. This
implementation. Labour-intensive PLI sectors such as food implies that while PLI and post-covid recovery have
products and textiles showed positive growth as well, though accelerated industrial growth and job creation, labour’s share
not as sharply as capital-intensive sectors such as electronics in the gains has not kept pace.
21