


Page 40 - CII-ARTHA
P. 40
ARTHA


                                                               Manufacturing Regains
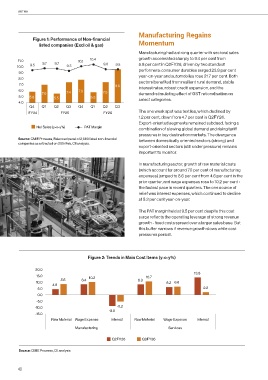
                Figure 1: Performance of Non-financial
                  listed companies (Excl oil & gas)            Momentum
                                                               Manufacturing had a strong quarter with sectoral sales
         11.0       9.7  9.7        10.1  10.4                 growth accelerated sharply to 9.4 per cent from
         10.0  9.5             9.3             9.6  9.5        5.8 per cent in Q2FY26, driven by two standout
                                                               performers: consumer durables surged 23.8 per cent
         9.0
         8.0                                                   year-on-year and automobiles rose 21.7 per cent. Both
                                                               sectors benefited from resilient rural demand, stable
         7.0                                        9.6        interest rates, robust credit expansion, and the
         6.0                        7.9
                    7.0        7.4             7.5             demand-stimulating effect of GST rationalisation on
         5.0  5.8        5.5             5.8                   select categories.
         4.0
              Q4    Q1   Q2   Q3    Q4   Q1    Q2   Q3
              FY24          FY25               FY26            The one weak spot was textiles, which declined by
                                                               1.2 per cent, down from 4.7 per cent in Q2FY26.
                                                               Export-oriented segments remained subdued, facing a
                 Net Sales (y-o-y%)   PAT Margin
                                                               combination of slowing global demand and rising tariff
                                                               pressures in key destination markets. The divergence
         Source: CMIE Prowess, Balanced panel of 2,680 listed non-financial   between domestically oriented sectors (strong) and
         companies as extracted on 20th Feb, CII analysis.
                                                               export-oriented sectors (still under pressure) remains
                                                               important to monitor.

                                                               In manufacturing sector, growth of raw material costs
                                                               (which account for around 70 per cent of manufacturing
                                                               expenses) jumped to 8.6 per cent from 4.6 per cent in the
                                                               prior quarter, and wage expenses rose to 10.2 per cent -
                                                               the fastest pace in recent quarters. The one source of
                                                               relief was interest expenses, which continued to decline
                                                               at 5.2 per cent year-on-year.


                                                               The PAT margin held at 9.5 per cent despite this cost
                                                               surge reflects the operating leverage of strong revenue
                                                               growth - fixed costs spread over a larger sales base. But
                                                               this buffer narrows if revenue growth slows while cost
                                                               pressures persist.


                                        Figure 2: Trends in Main Cost Items (y-o-y%)

                 20.0
                                                                                       13.8
                 15.0                    10.2                     10.7
                            8.6      8.4                      8.3
                 10.0                                                      6.2 6.6
                        4.6
                  5.0                                                                      2.2
                  0.0
                 -5.0
                 -10.0                               -5.2
                                                 -8.8
                 -15.0
                        Raw Material Wage Expense  Interest  Raw Material  Wage Expense  Interest
                                  Manufacturing                             Services

                                                   Q2FY26       Q3FY26

         Source: CMIE Prowess, CII analysis


         40

