


Page 44 - CII-ARTHA
P. 44
ARTHA


         An examination of employment trends since 1990        Several explanations have been proposed for the
         reveals a gradual decline, or, at best stagnation, in male   persistently low female LFPR in India, including the
         labour force participation, contrasted by a puzzling   following:
         decline and only a recent, modest recovery in female
         participation. According to the PLFS 2023–24, the     •   As household incomes rise, women in certain income
         Female Labour Force Participation Rate (FLFPR) is      groups tend to withdraw from paid employment, often
         estimated at 41.7 per cent, compared to 78.8 per cent   prioritising domestic responsibilities - known as the
         for males. Notably, much of the recent increase in     “U-shaped” hypothesis of female labour supply.
         female LFPR has been driven by the rural sector,
         particularly through self-employment and unpaid family   •   Higher enrolment of women in secondary and tertiary
         work which is a result of distress employment. Despite   education delays, or in some cases reduces, their entry
         sustained economic growth and targeted policy          into the labour force.
         interventions, significant gender gaps in labour force
         participation continue to persist, underscoring the   •   Many women engaged in unpaid domestic or care work
         structural and social barriers that constrain women’s   are not actively seeking employment and are therefore
         engagement in the workforce.
                                                                excluded from official labour force statistics, thus
         To ensure cross-country comparability in the subsequent   reducing the FLFPR.
         analysis, this paper relies on the World Bank’s World
         Development Indicators (WDI) database, for which the   •   Deep-rooted social norms, safety concerns, caregiving
         latest harmonised data are available up to 2024. The   responsibilities, and limited access to or lack of
         source of this data is ILO Modelled Estimates database   employment opportunities continue to constrain
         (ILOEST), International Labour Organization (ILO).     women’s participation in paid work.

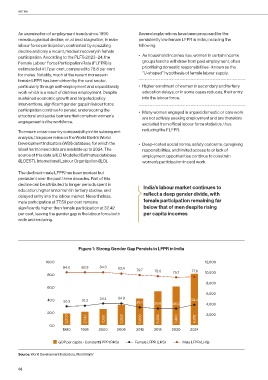
         The decline in male LFPR has been modest but
         persistent over the past three decades. Part of this
         decline can be attributed to longer periods spent in
         education, higher enrolment in tertiary studies, and    India’s labour market continues to
         delayed entry into the labour market. Nevertheless,     reflect a deep gender divide, with
         male participation at 77.59 per cent remains            female participation remaining far
         significantly higher than female participation at 32.42   below that of men despite rising
         per cent, leaving the gender gap in the labour force both   per capita incomes
         wide and enduring.


                                    Figure 1: Strong Gender Gap Persists in LFPR in India


                     100.0                                                                  12,000
                             84.0    83.9    84.3    82.4
                                                              79.7    78.0            77.6
                      80.0                                                    75.7          10,000
                                                                                             8,000
                      60.0
                                                                                             6,000
                      40.0   30.3    31.3    34.4    34.9     28.4    26.6    26.0    32.4   4,000


                      20.0                                                                   2,000
                                2,203   2,542   3,100    3,882   5,059   6,488   7,400   9,818

                       0.0
                             1990    1995    2000    2005     2010   2015    2020    2024

                           GDP per capita - Constant$ PPP (RHS)  Female LFPR (LHS)  Male LFPR (LHS)


         Source: World Development Indicators, World Bank 1


         44

