
Page 53 - CII ARTHA
P. 53
OCTOBER 2025
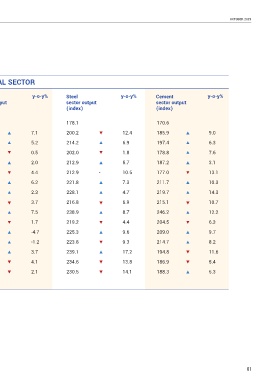
INDUSTRIAL SECTOR
Overall IIP y-o-y% Power y-o-y% Electricity y-o-y% Steel y-o-y% Cement y-o-y%
(index) consumption sector output sector output sector output
('000 MU) (index) (index) (index)
FY23 138.5 125.8 185.2 178.1 170.6
FY24 146.6 5.8 135.0 7.3 198.3 7.1 200.2 12.4 185.9 9.0
FY25 152.6 4.1 141.8 4.6 208.6 5.2 214.2 6.9 197.4 6.3
Sep-24 146.9 3.2 141.4 0.7 206.9 0.5 202.0 1.8 178.8 7.6
Oct-24 150.2 3.7 140.5 1.1 207.8 2.0 212.9 5.7 187.2 3.1
Nov-24 148.1 5.0 124.4 4.0 184.1 4.4 212.9 - 10.5 177.0 13.1
Dec-24 157.7 3.5 130.4 5.9 192.8 6.2 221.8 7.3 211.7 10.3
Jan-25 161.3 5.1 137.5 2.7 201.7 2.3 228.1 4.7 219.7 14.3
Feb-25 151.1 2.7 131.5 2.9 194.0 3.7 216.8 6.9 215.1 10.7
Mar-25 166.3 3.9 148.5 6.7 219.5 7.5 238.9 8.7 246.2 12.2
Apr-25 151.8 2.8 147.5 2.2 215.7 1.7 219.2 4.4 204.5 6.3
May-25 157.6 1.9 148.7 -4.9 218.5 -4.7 225.3 9.6 209.0 9.7
Jun-25 153.3 1.7 150.0 -1.5 220.1 -1.2 223.8 9.3 214.7 8.2
Jul-25 156.2 4.6 153.6 2.0 228.4 3.7 239.1 17.2 194.8 11.6
Aug-25 151.7 4.1 150.5 4.3 221.1 4.1 234.6 13.8 186.9 5.4
Sep-25 152.8 4.0 145.9 3.2 211.3 2.1 230.5 14.1 188.3 5.3
The movement in arrows denotes the improvement/deterioration vis-à-vis the previous month. NA is not available
51