
Page 50 - CII ARTHA
P. 50
ARTHA
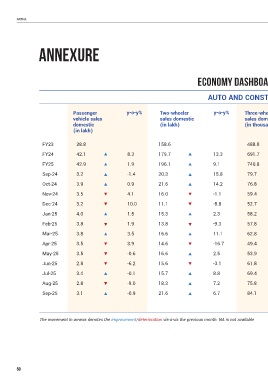
Annexure
Economy Dashboard - October 2025
AUTO AND CONSTRUCTION SECTOR
Passenger y-o-y% Two-wheeler y-o-y% Three-wheeler y-o-y% Tractor sales y-o-y% Construction y-o-y%
vehicle sales sales domestic sales domestic domestic equipment
domestic (in lakh) (in thousands) (in thousands) sales domestic
(in lakh) (in thousands)
FY23 38.8 158.6 488.8 945.3 99.7
FY24 42.1 8.3 179.7 13.3 691.7 41.5 867.2 -8.3 123.7 24.0
FY25 42.9 1.9 196.1 9.1 740.8 7.1 922.6 6.4 126.1 2.0
Sep-24 3.2 -1.4 20.3 15.8 79.7 6.7 100.5 3.7 11.3 2.9
Oct-24 3.9 0.9 21.6 14.2 76.8 -0.7 144.7 22.4 13.1 7.8
Nov-24 3.5 4.1 16.0 -1.1 59.4 -1.3 71.3 -1.3 11.3 -2.5
Dec-24 3.2 10.0 11.1 -8.8 52.7 3.5 50.9 13.9 11.4 20.9
Jan-25 4.0 1.5 15.3 2.3 58.2 8.6 61.9 11.4 12.5 -5.5
Feb-25 3.8 1.9 13.8 -9.3 57.8 5.9 58.8 35.9 11.5 -0.4
Mar-25 3.8 3.5 16.6 11.1 62.8 10.8 79.9 25.3 13.1 -2.7
Apr-25 3.5 3.9 14.6 -16.7 49.4 0.7 82.8 7.6 9.3 1.7
May-25 3.5 -0.6 16.6 2.5 53.9 -3.3 90.5 9.1 8.3 -1.7
Jun-25 2.8 -6.2 15.6 -3.1 61.8 3.8 112.7 10.5 7.2 -14.5
Jul-25 3.4 -0.1 15.7 8.8 69.4 17.5 64.3 8.1 6.9 -8.9
Aug-25 2.8 -9.0 18.3 7.2 75.8 8.3 64.3 28.3 7.9 -7.2
Sep-25 3.1 -0.9 21.6 6.7 84.1 5.5 146.2 45.4 10.2 -9.8
The movement in arrows denotes the improvement/deterioration vis-à-vis the previous month. NA is not available
50