
Page 55 - CII ARTHA
P. 55
ARTHA
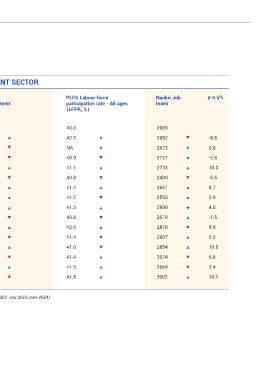
EMPLOYMENT SECTOR
Net joinees in y-o-y% Days of employment y-o-y% CMIE PLFS Labour force Naukri Job y-o-y%
EPFO demanded by unemployment participation rate - All ages Index
(in thousands) households in rate (%) (LFPR, %)
MNREGA (in crore)
FY23 13851.7 6.2 7.6 40.0 2909
FY24 13148.2 -5.1 6.0 -3.2 8.1 42.3 2652 -8.8
FY25 12978.2 -1.3 5.8 -3.3 8.1 NA 2673 0.8
Sep-24 1005.1 -25.3 1.9 - -14.2 7.7 40.9 2727 -3.8
Oct-24 525.4 -53.9 2.0 -9.3 8.9 41.1 2733 10.0
Nov-24 864.2 -21.8 2.2 3.0 7.7 40.8 2430 -5.5
Dec-24 995.8 -36.2 2.6 18.8 7.8 41.4 2651 8.7
Jan-25 1320.9 -17.6 2.7 13.4 7.8 41.2 2550 3.9
Feb-25 1327.5 -14.2 2.7 1.5 8.2 41.3 2890 4.0
Mar-25 1457.7 1.2 2.4 1.7 7.6 40.8 2618 -1.5
Apr-25 1431.6 32.5 2.0 -33.4 7.7 42.0 2878 8.9
May-25 1462.5 34.9 2.8 -24.1 6.9 41.4 2807 0.3
Jun-25 1904.5 77.5 2.8 -19.4 7.5 41.0 2854 10.5
Jul-25 2104.4 70.8 1.7 -27.0 6.8 41.4 3074 6.8
Aug-25 NA 1.2 -37.2 7.0 41.5 2664 3.4
Sep-25 NA 1.2 -38.2 6.4 41.8 3002 10.1
Note: For PLFS annual LFPR (%), period under consideration is July-June, as per PLFS annual reports (July 2022-June 2023; July 2023-June 2024)
The movement in arrows denotes the improvement/deterioration vis-à-vis the previous month. NA is not available
52