
Page 60 - CII ARTHA
P. 60
OCTOBER 2025
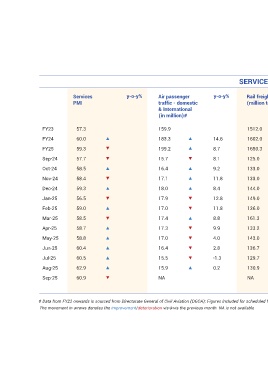
SERVICE SECTOR
Services y-o-y% Air passenger y-o-y% Rail freight y-o-y% Port Cargo y-o-y% Number of y-o-y%
PMI traffic - domestic (million ton) traffic - broadband
& International Major Ports subscribers
(in million)# (million ton) (in million)
FY23 57.3 159.9 1512.0 768.0 846.6
FY24 60.0 183.3 14.6 1602.0 5.9 802.1 4.4 924.1 9.2
FY25 59.3 199.2 8.7 1650.3 3.0 853.6 6.4 944.1 2.2
Sep-24 57.7 15.7 8.1 125.0 1.2 65.6 5.9 944.4 6.7
Oct-24 58.5 16.4 9.2 133.0 3.1 68.2 -3.2 941.5 6.0
Nov-24 58.4 17.1 11.8 133.0 - 3.6 67.5 -4.8 944.7 5.4
Dec-24 59.3 18.0 8.4 144.0 1.6 72.1 3.1 945.0 4.5
Jan-25 56.5 17.9 12.8 149.0 1.7 77.0 6.2 945.2 3.8
Feb-25 59.0 17.0 11.8 136.0 -2.4 71.2 6.4 944.0 3.0
Mar-25 58.5 17.4 8.8 161.3 1.8 82.8 12.0 944.1 2.2
Apr-25 58.7 17.3 9.9 133.2 0.2 72.0 7.0 943.1 1.6
May-25 58.8 17.0 4.0 143.0 0.3 75.2 4.4 974.9 4.3
Jun-25 60.4 16.4 2.8 136.7 -1.1 72.9 5.5 979.7 4.1
Jul-25 60.5 15.5 -1.3 129.7 -1.8 72.9 4.0 984.7 4.1
Aug-25 62.9 15.9 0.2 130.9 6.4 71.4 2.6 989.6 4.3
Sep-25 60.9 NA NA 73.1 11.5 995.6 5.4
# Data from FY23 onwards is sourced from Directorate General of Civil Aviation (DGCA); Figures included for scheduled flights only
The movement in arrows denotes the improvement/deterioration vis-à-vis the previous month. NA is not available
55